Python IDLE
by K. Yue
1. Python IDLE
- Python IDLE is bundled in the Python distribution. There is no need for separate installation.
- IDLE can be regarded as a very simple Integrated Development Environment (IDE). It is used in this class.
2. Running IDLE shell as interpreter
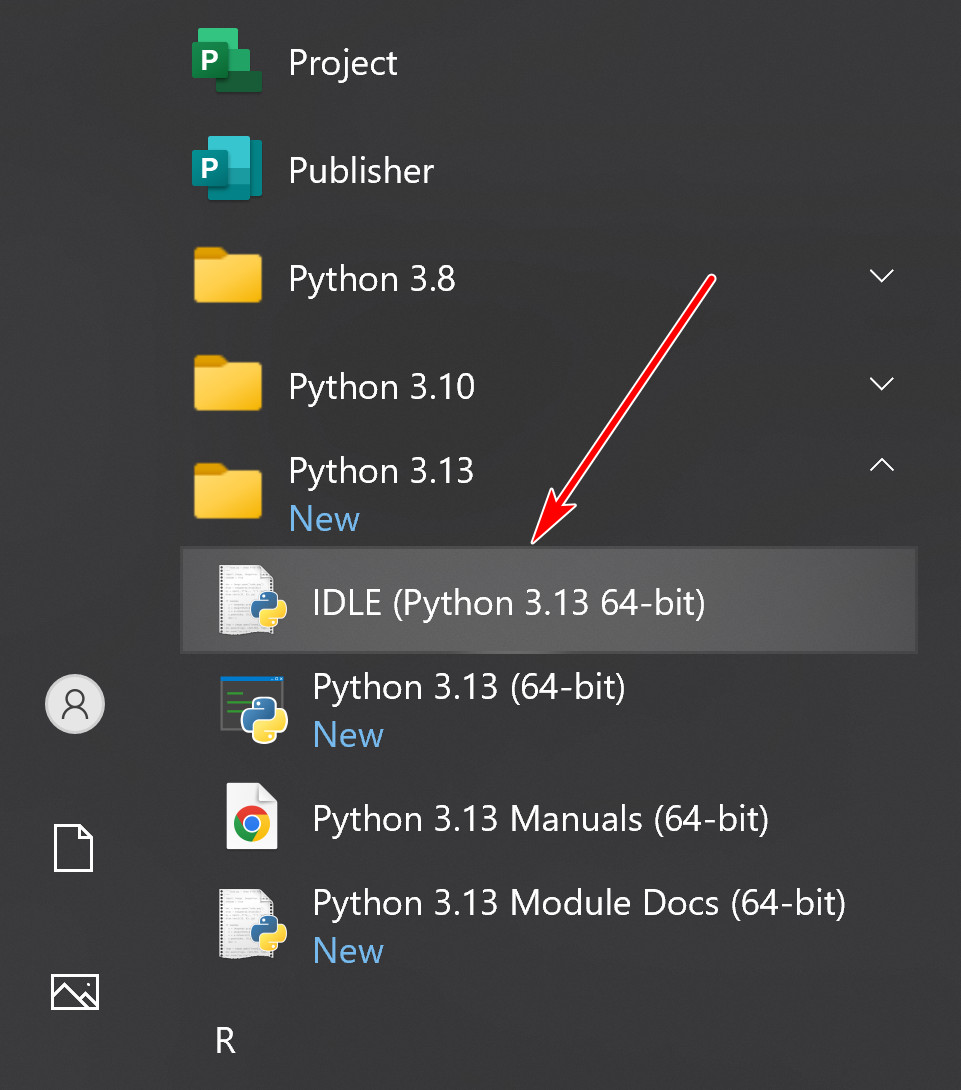
- When you start IDLE, a shell window appears.
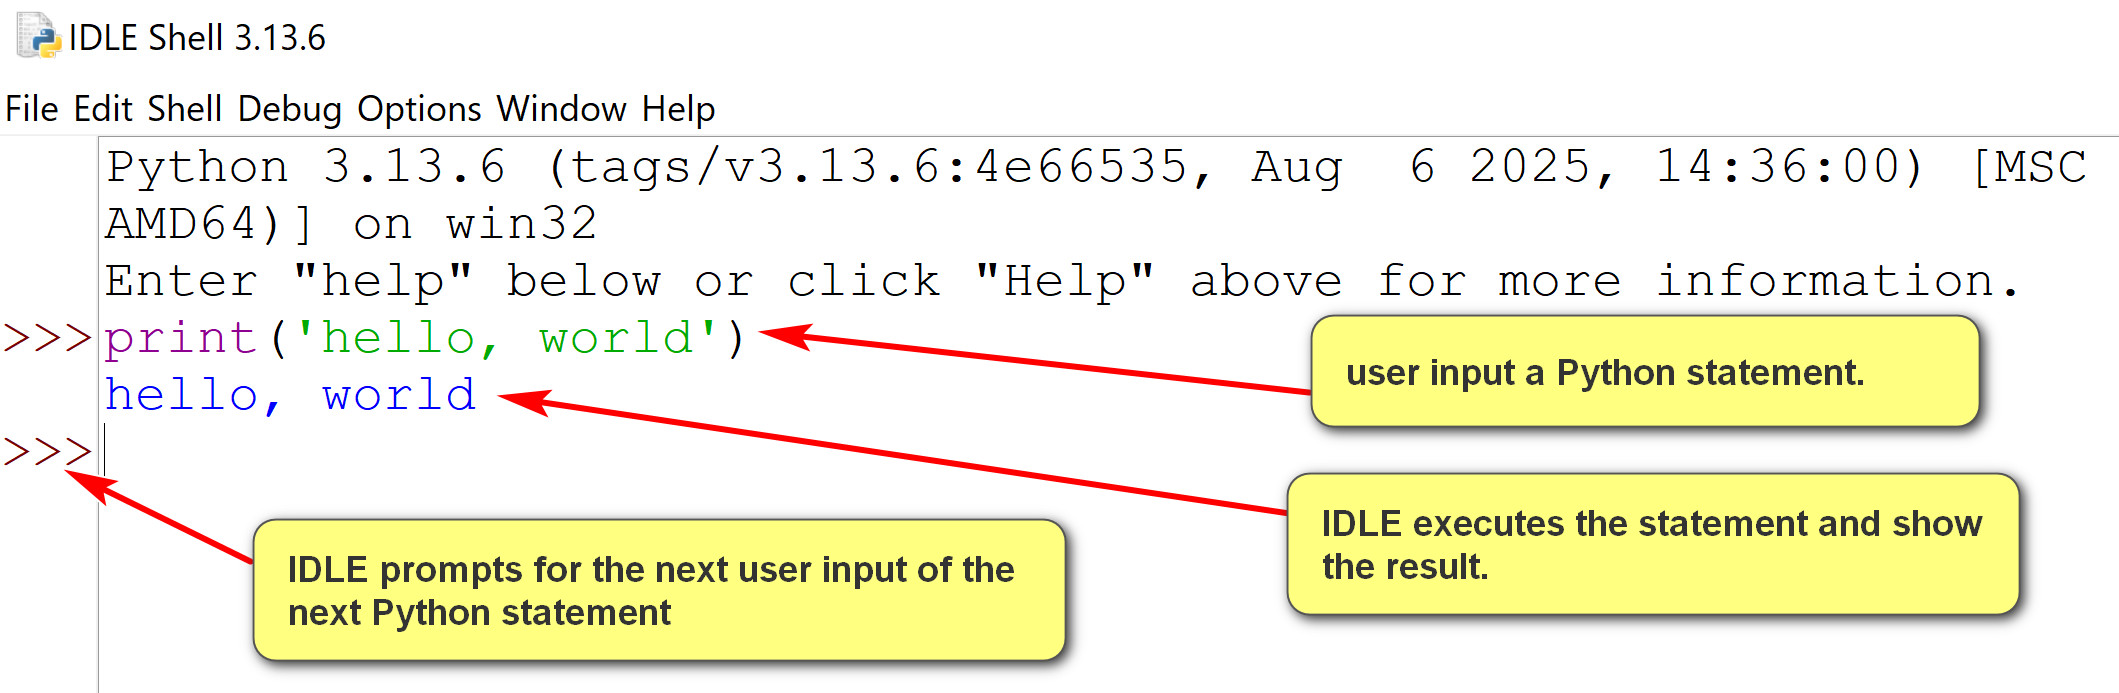
- IDLE shell is an interactive interpreter with REPL (Read-Evaluate-Print loop)
- Read a Python statement, single-lined or multiple-lined.
- Evaluate or execute the statement.
- Print the result of execution of the statement.
- A shell contains the collection of Python code the user entered interactively.
2.1 Logging a shell session
- Logging is a crucial practice and habit in software development.
- Logging tracks program behavior and problems, enables debugging, supports performance analysis, supports auditing, monitors security and informs users, administrators, and developers.
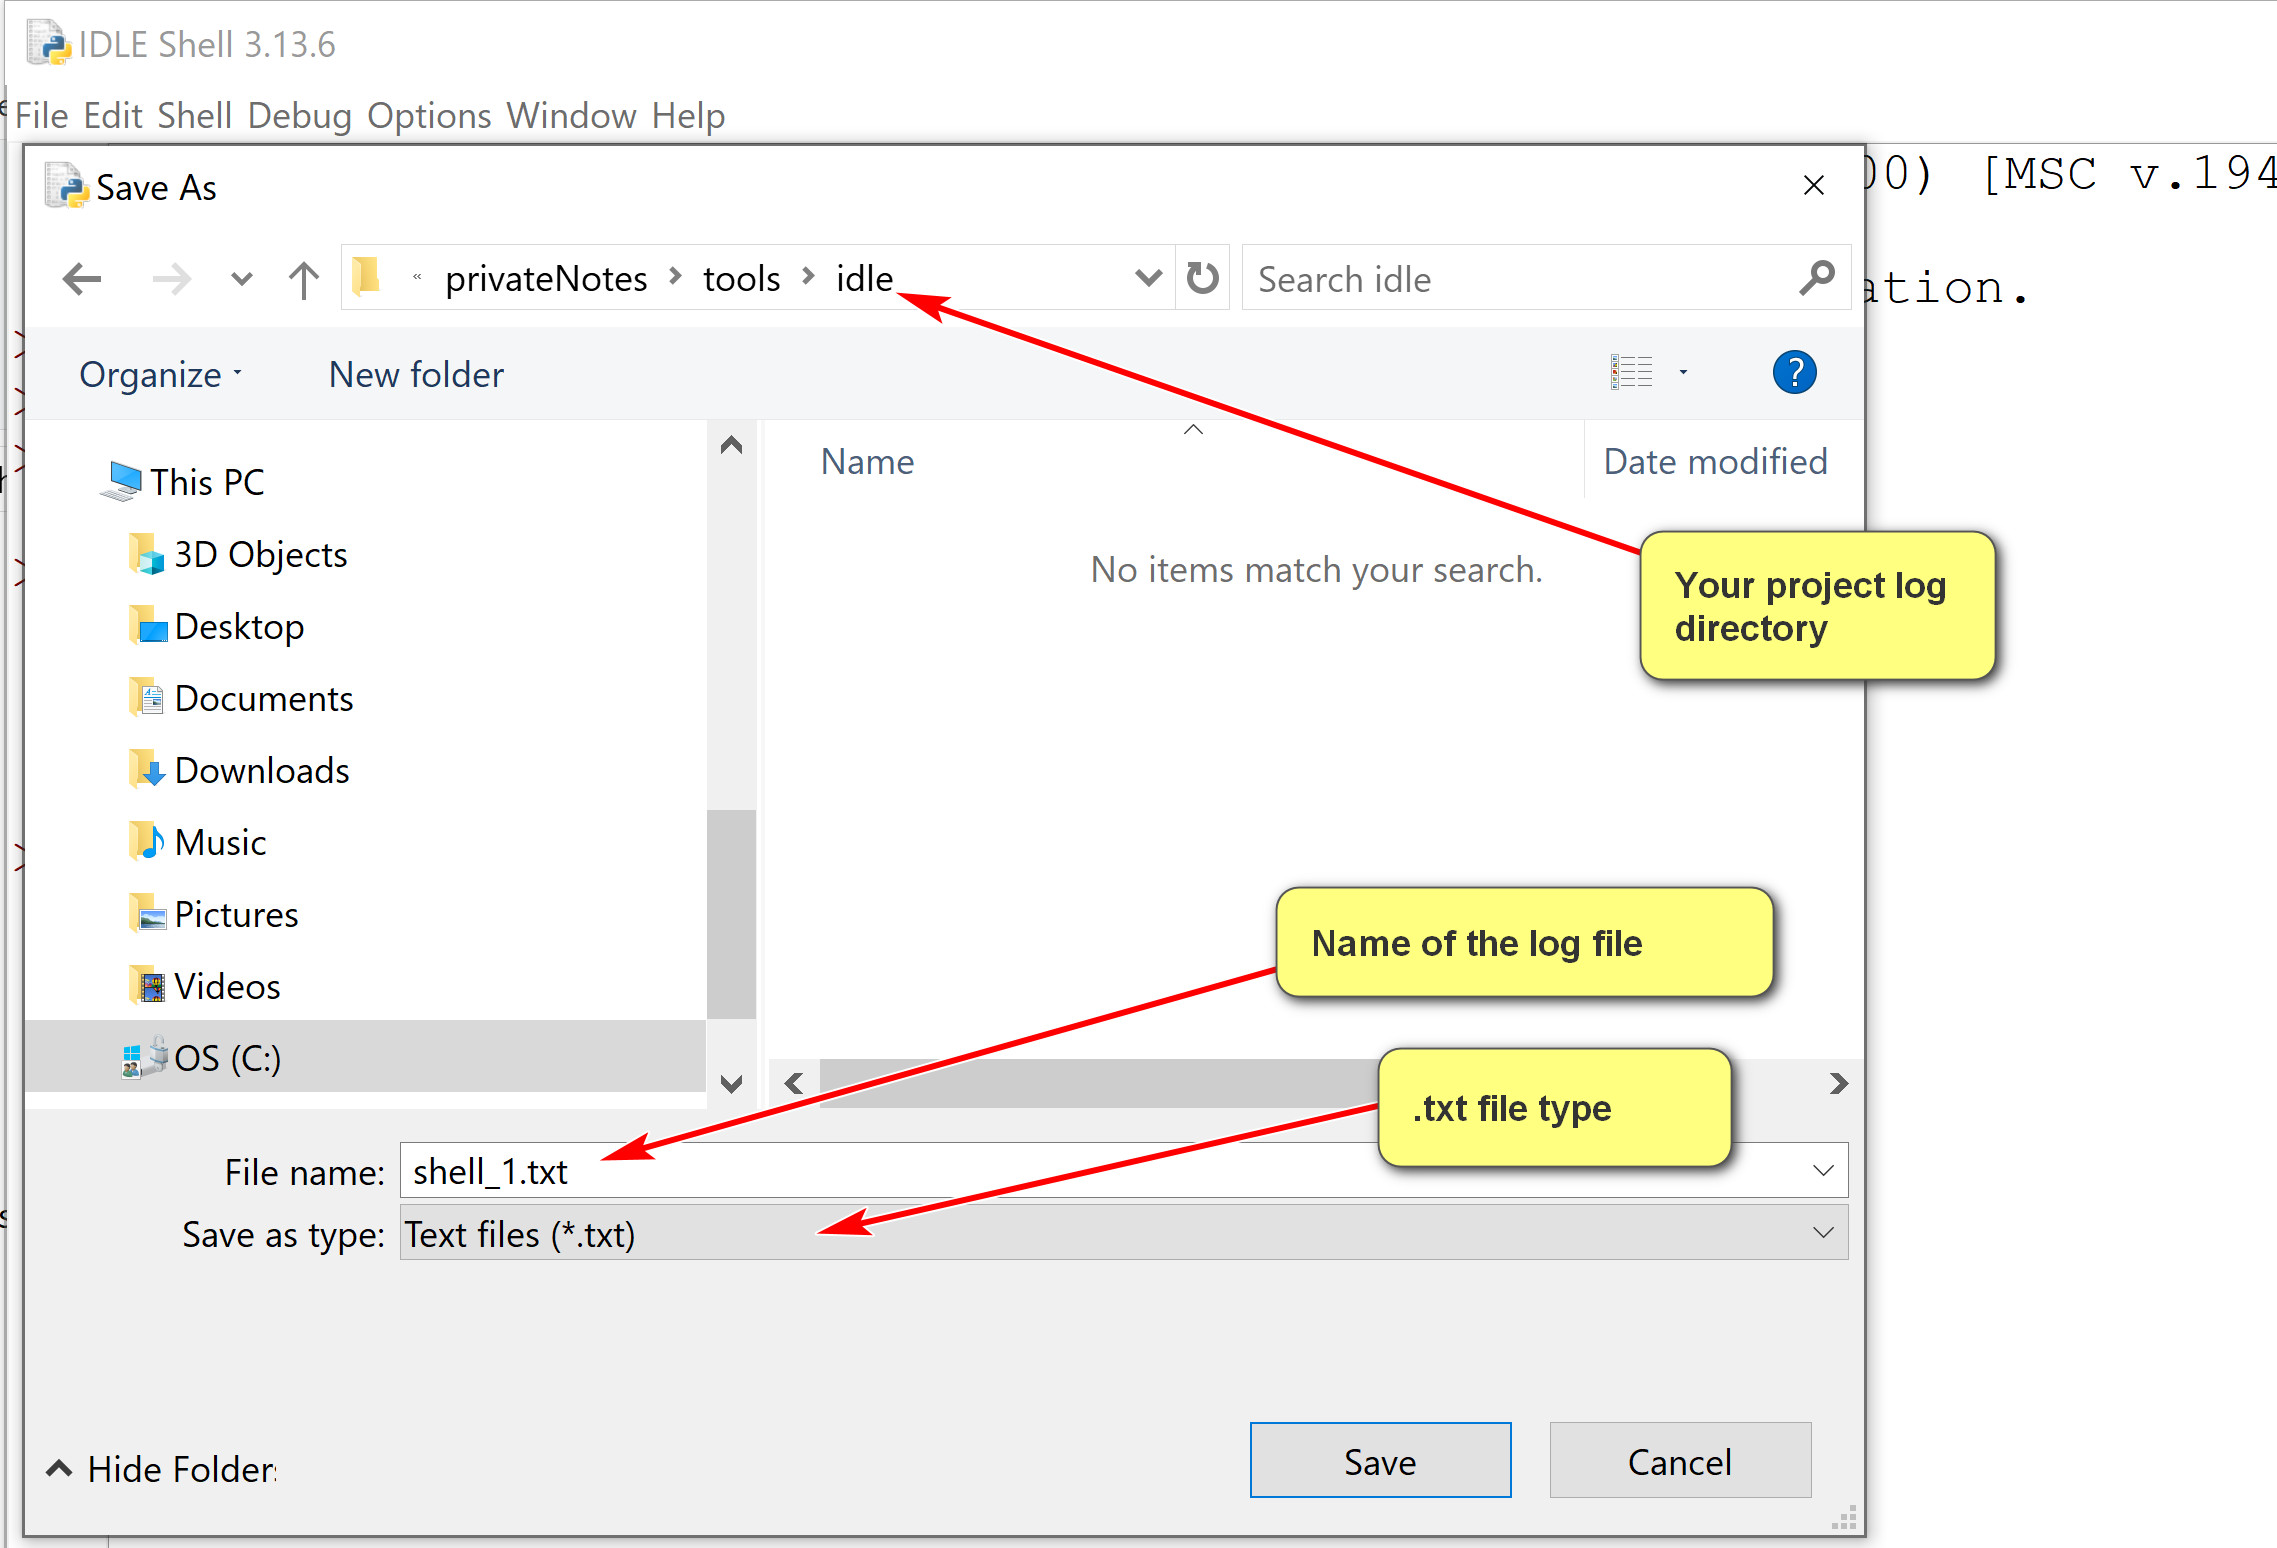
- IDLE shell session can be logged by saving it in a file.
Shell Menu
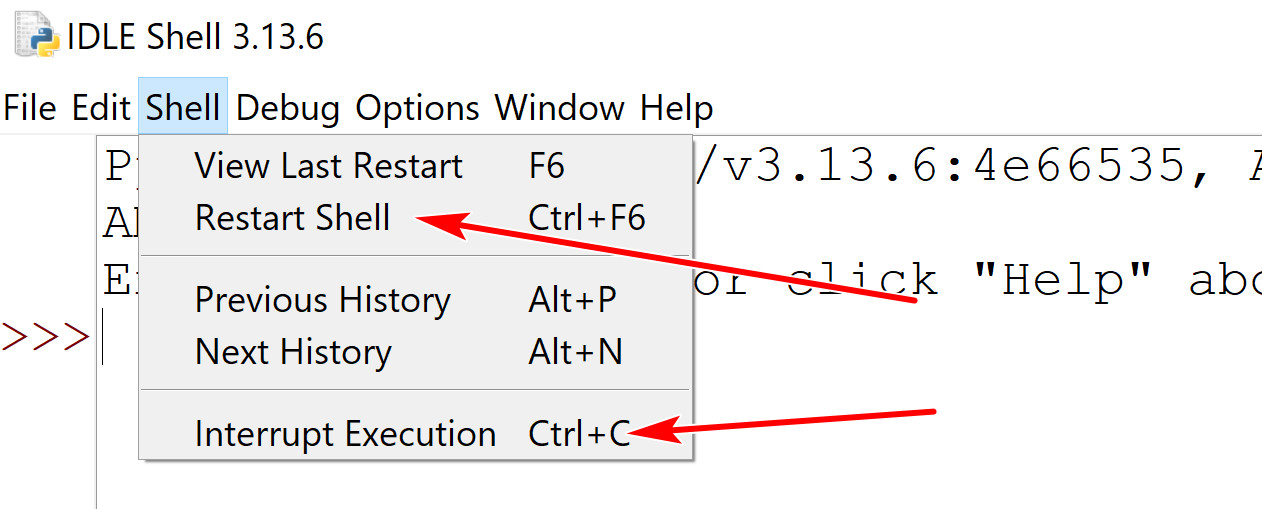
- Two buttons you may use:
- Restart shell: start a new shell session.
- Interrupt Execution: stop the execution (in case you get into an infinite loop)
3. Python program file editing and execution
- Shell includes a text editor.
- One can open an existing Python program file, or create anew Python program file.
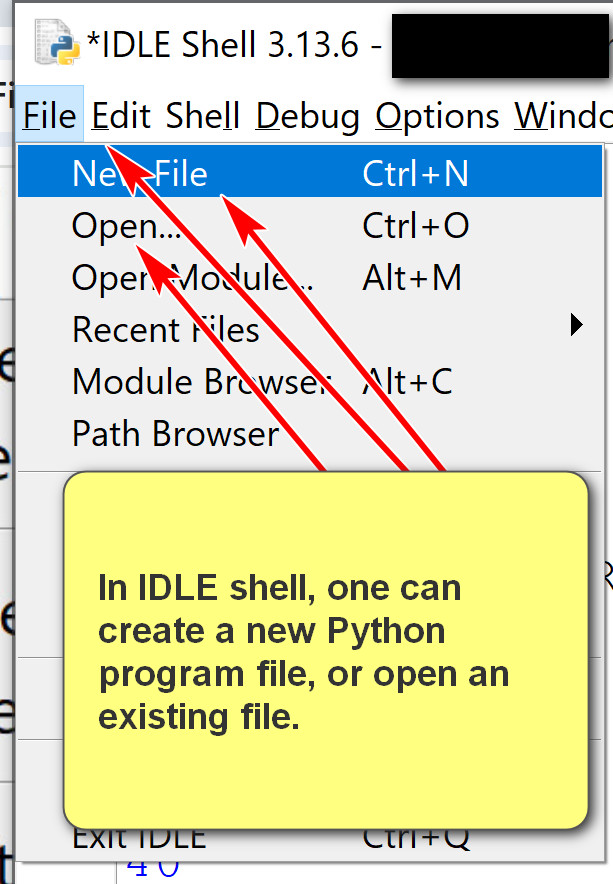
- The file editor has many features.
- Some features you may use:
- Use the options menu to show line number.
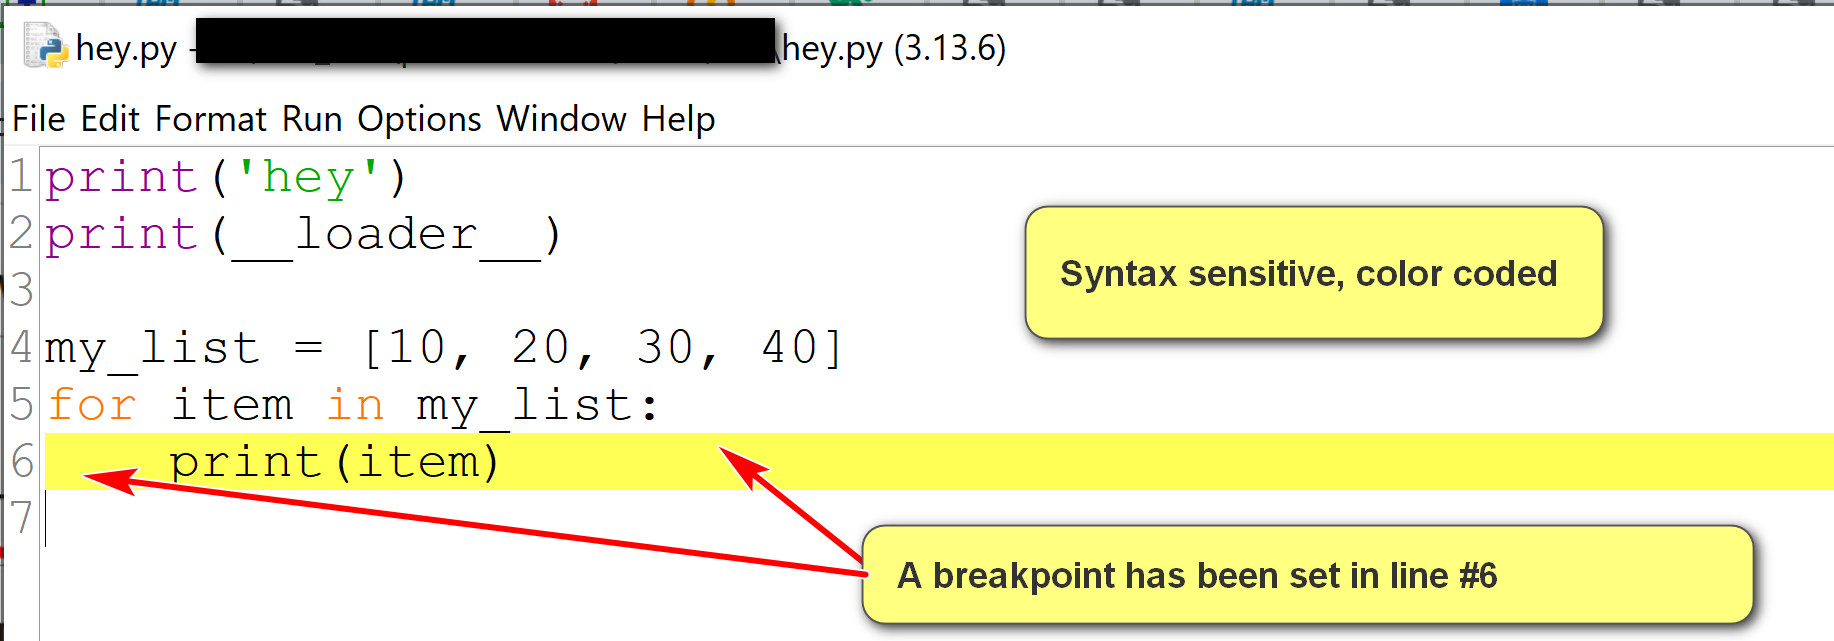
- Set and clear breakpoints for debugging.
- Run the program by using Run->Run Module.
4. Debugging in IDLE
- A good tutorial in IDLE: https://www.cs.uky.edu/~keen/help/debug-tutorial/debug.html. Contain more than needed in the class.
- To debug a Python program:
- Open the Python program using IDLE Shell: File -> Open.
- Turn on the Shell debugger: Go->Debugger
- Run the program in the editor using Run->Run Module.
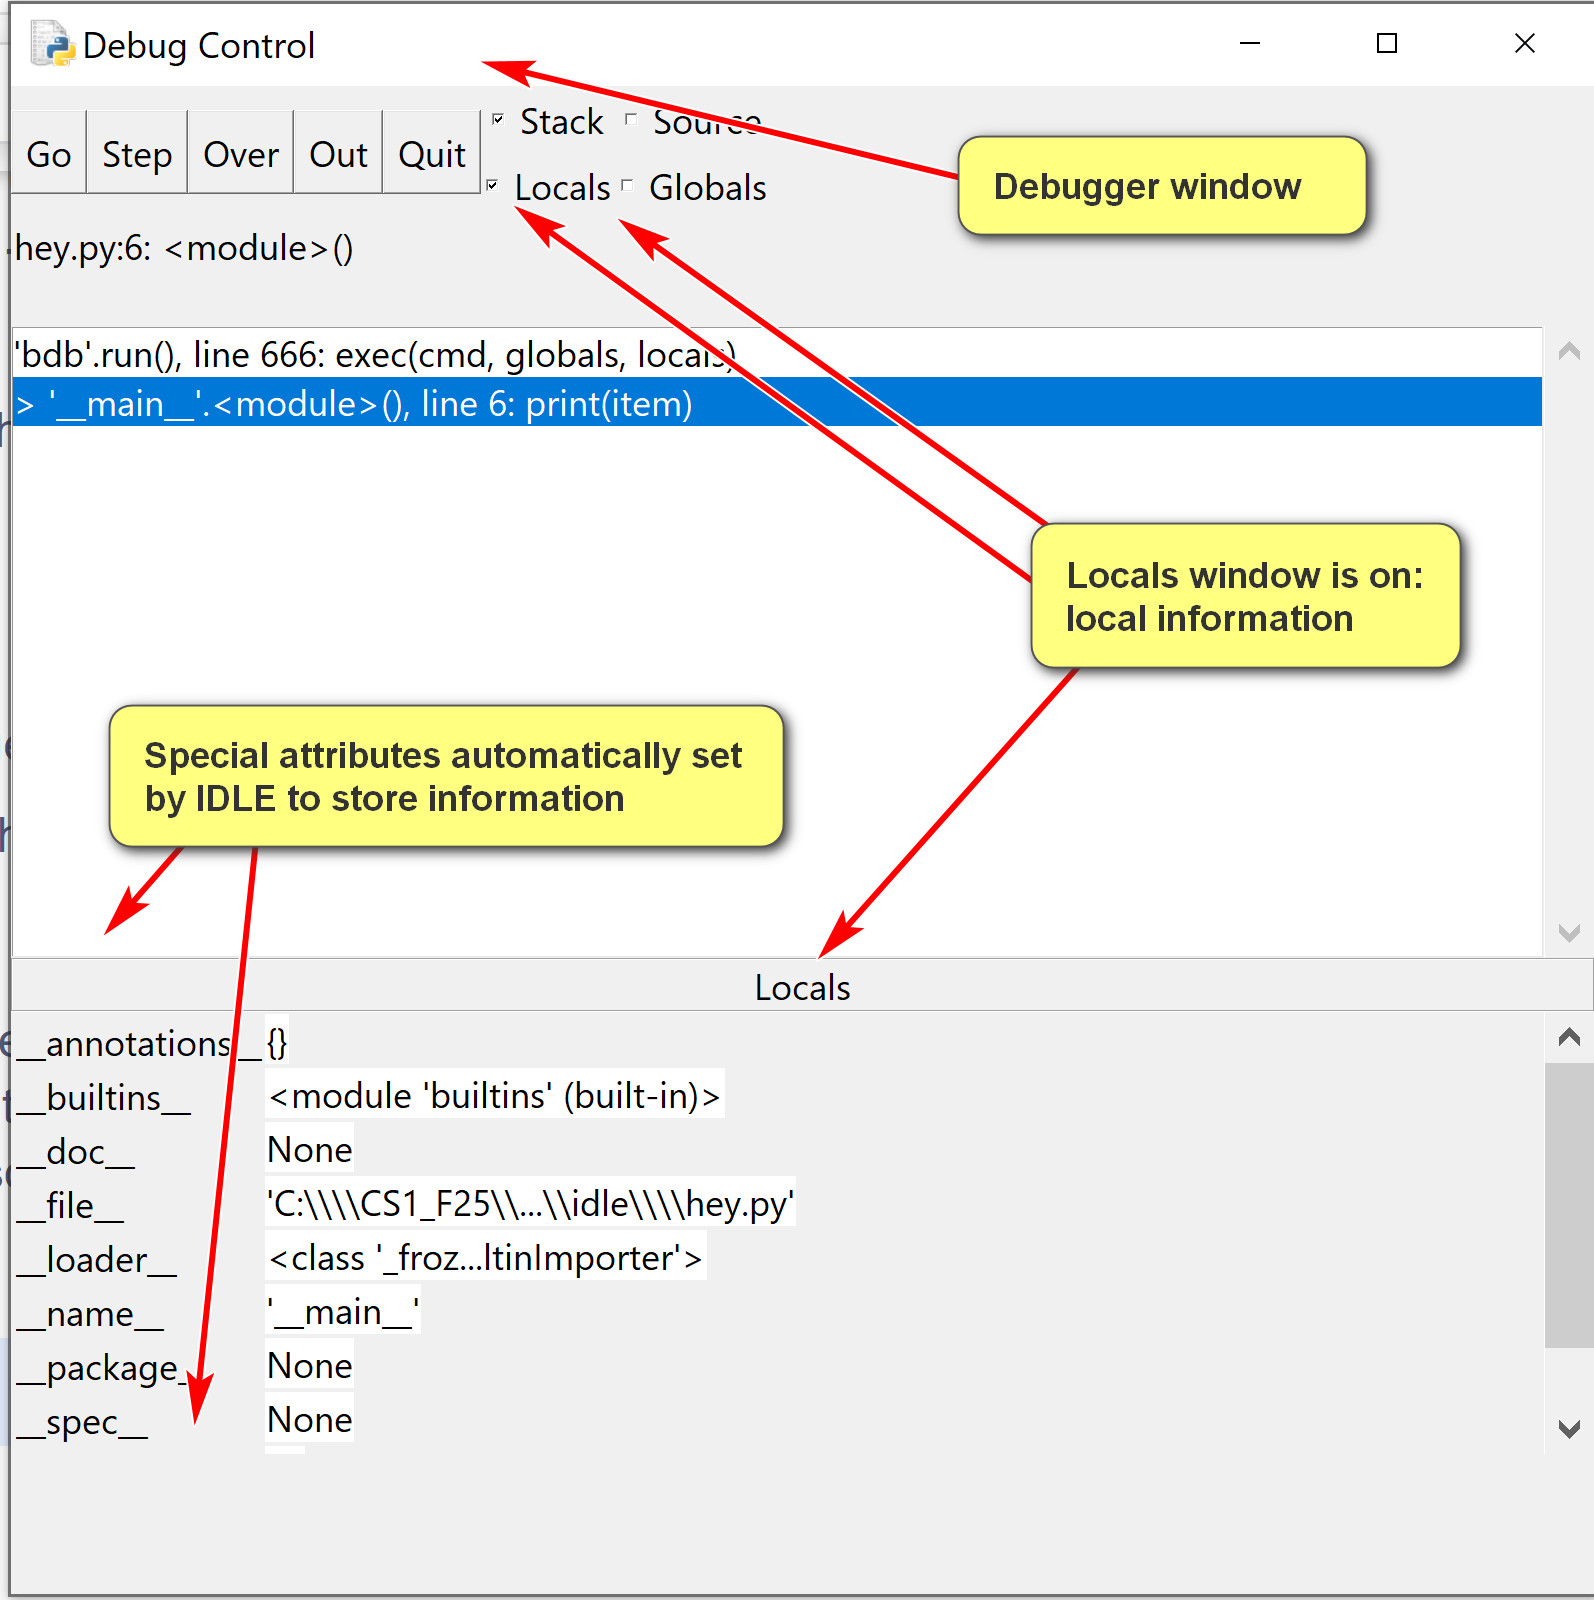
- Use the debugger window.
- Some basics:
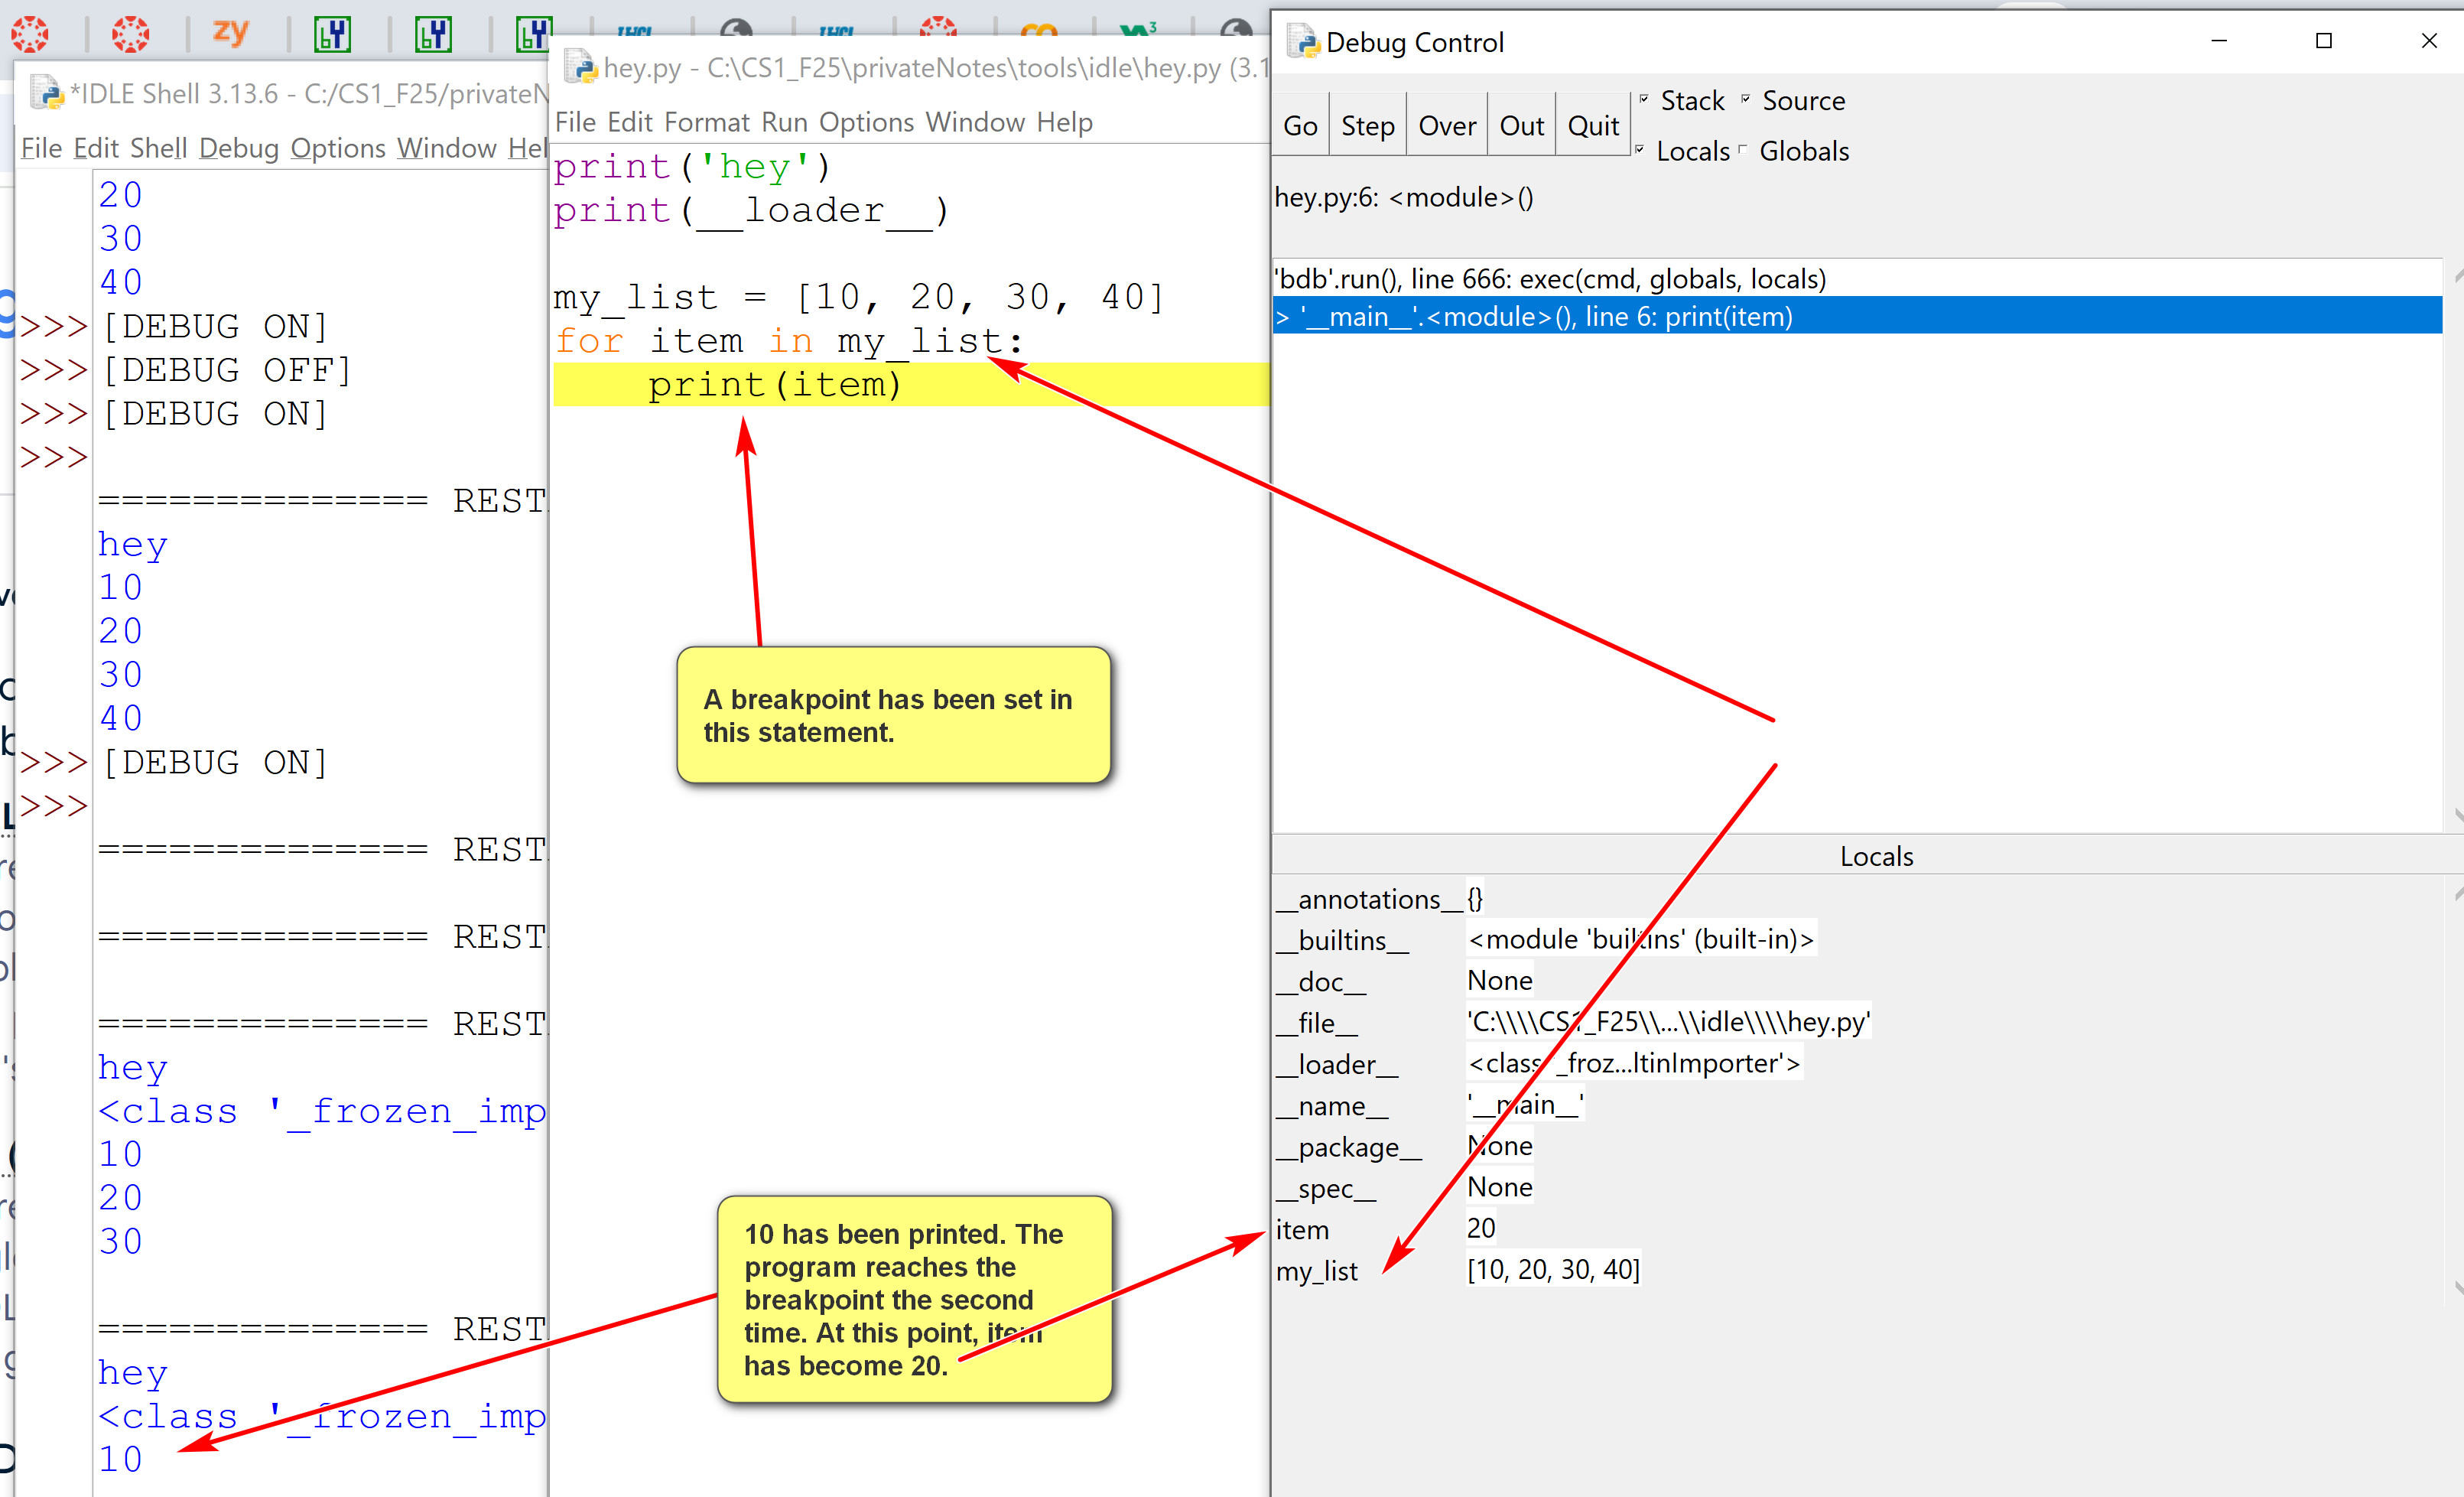
- Use the go button in the debugger window to execute.
- Set and clear breakpoint in the editor.
- Examine the locals window in the debugger.
When the debugger window is started, in the example below, the locals window shows values of local variables.
An example of using breakpoints:
- Useful debugger options:
- step: one step at a time, including lower level function calls.
- over: one step at a time, not including lower level function calls. Probably more useful than 'step'.
- go: executes full theprogram.