ITEC 3335
Database Development
Fall 2017
Homework #9
Data Analysis and Visualization
This assignment uses the popular data analysis and visualization software Tableau. You can receive a free student copy of Tableau: https://www.tableau.com/academic/students. Download and install 'Tableau Desktop."
Use Coffee Chain.mdb as your data source for Tableau Desktop. For each of the following questions, describe how you achieve the data analysis and visualization with the help of one or more annotated screenshots.
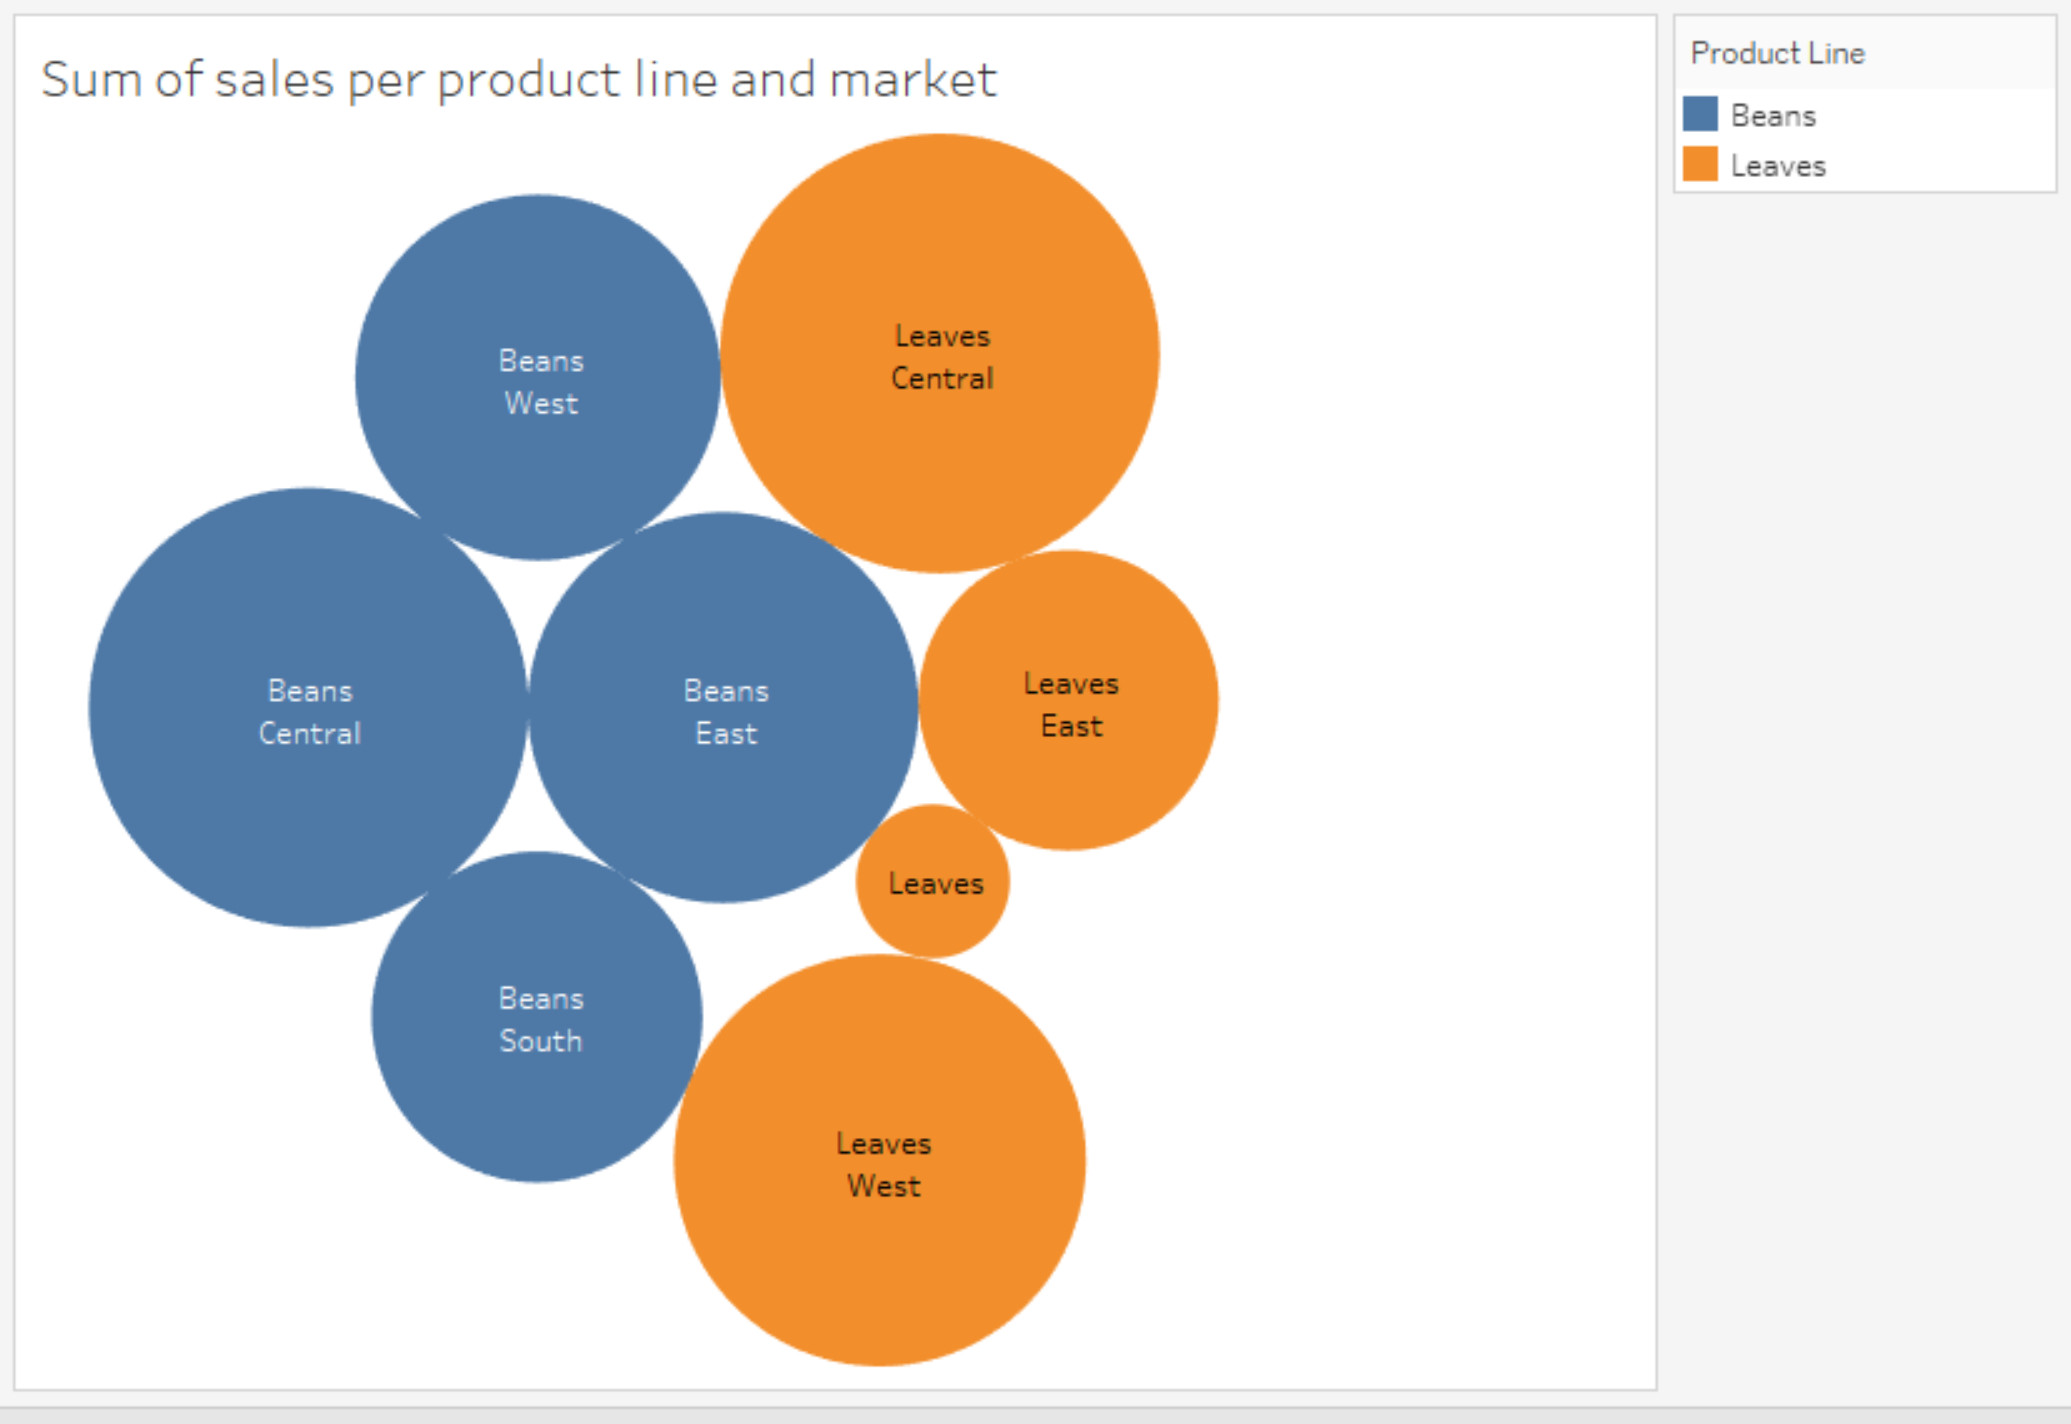
[1] Sum of sales for each product type and market.
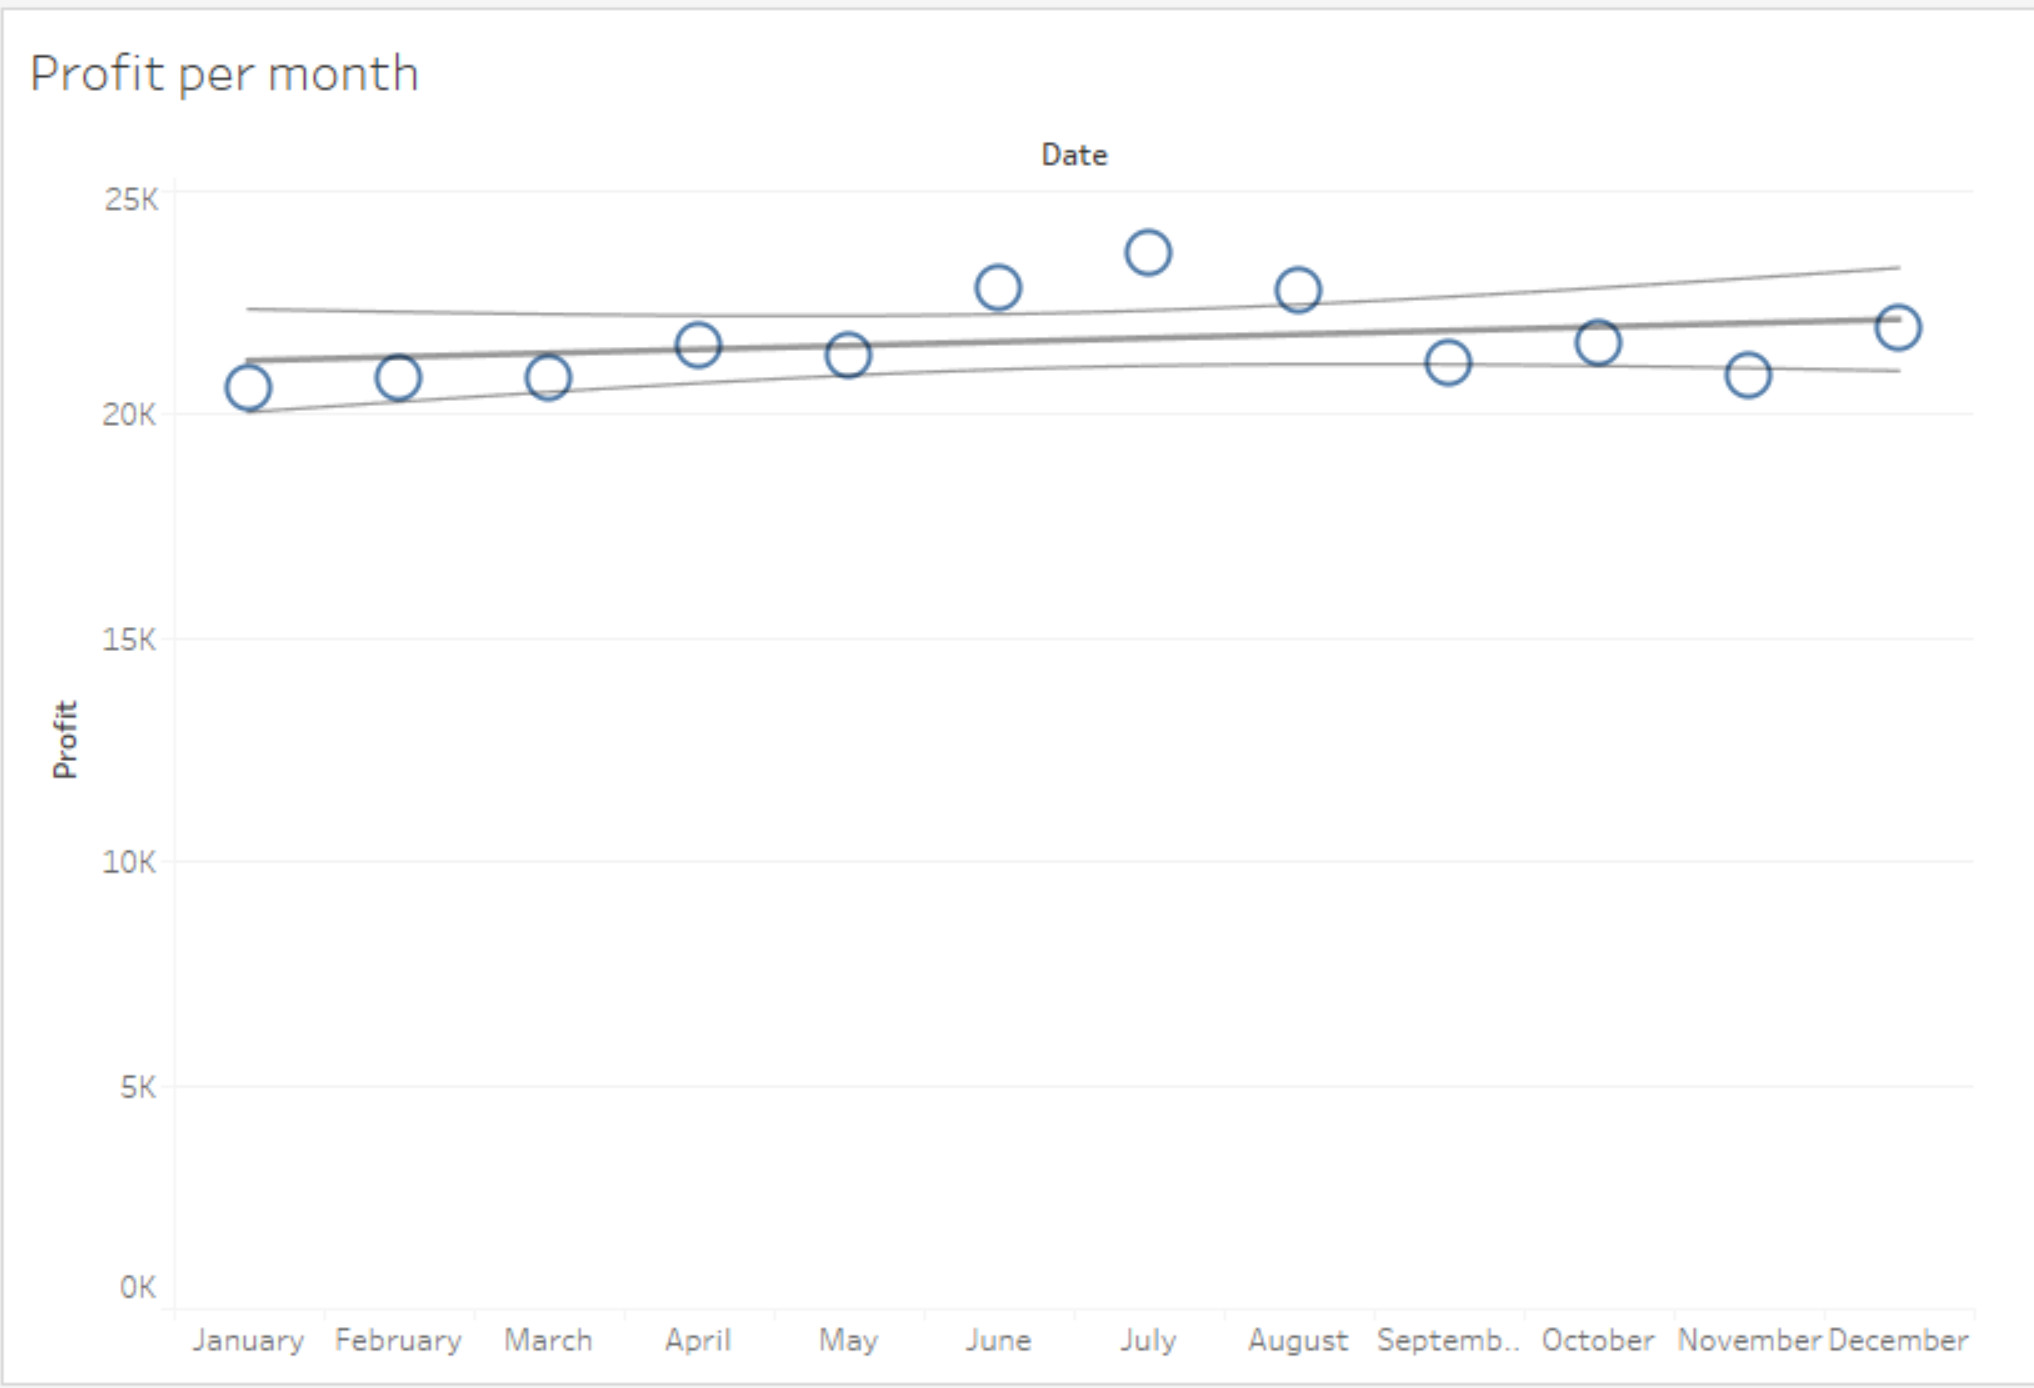
[2] Total profit per month with trend lines.
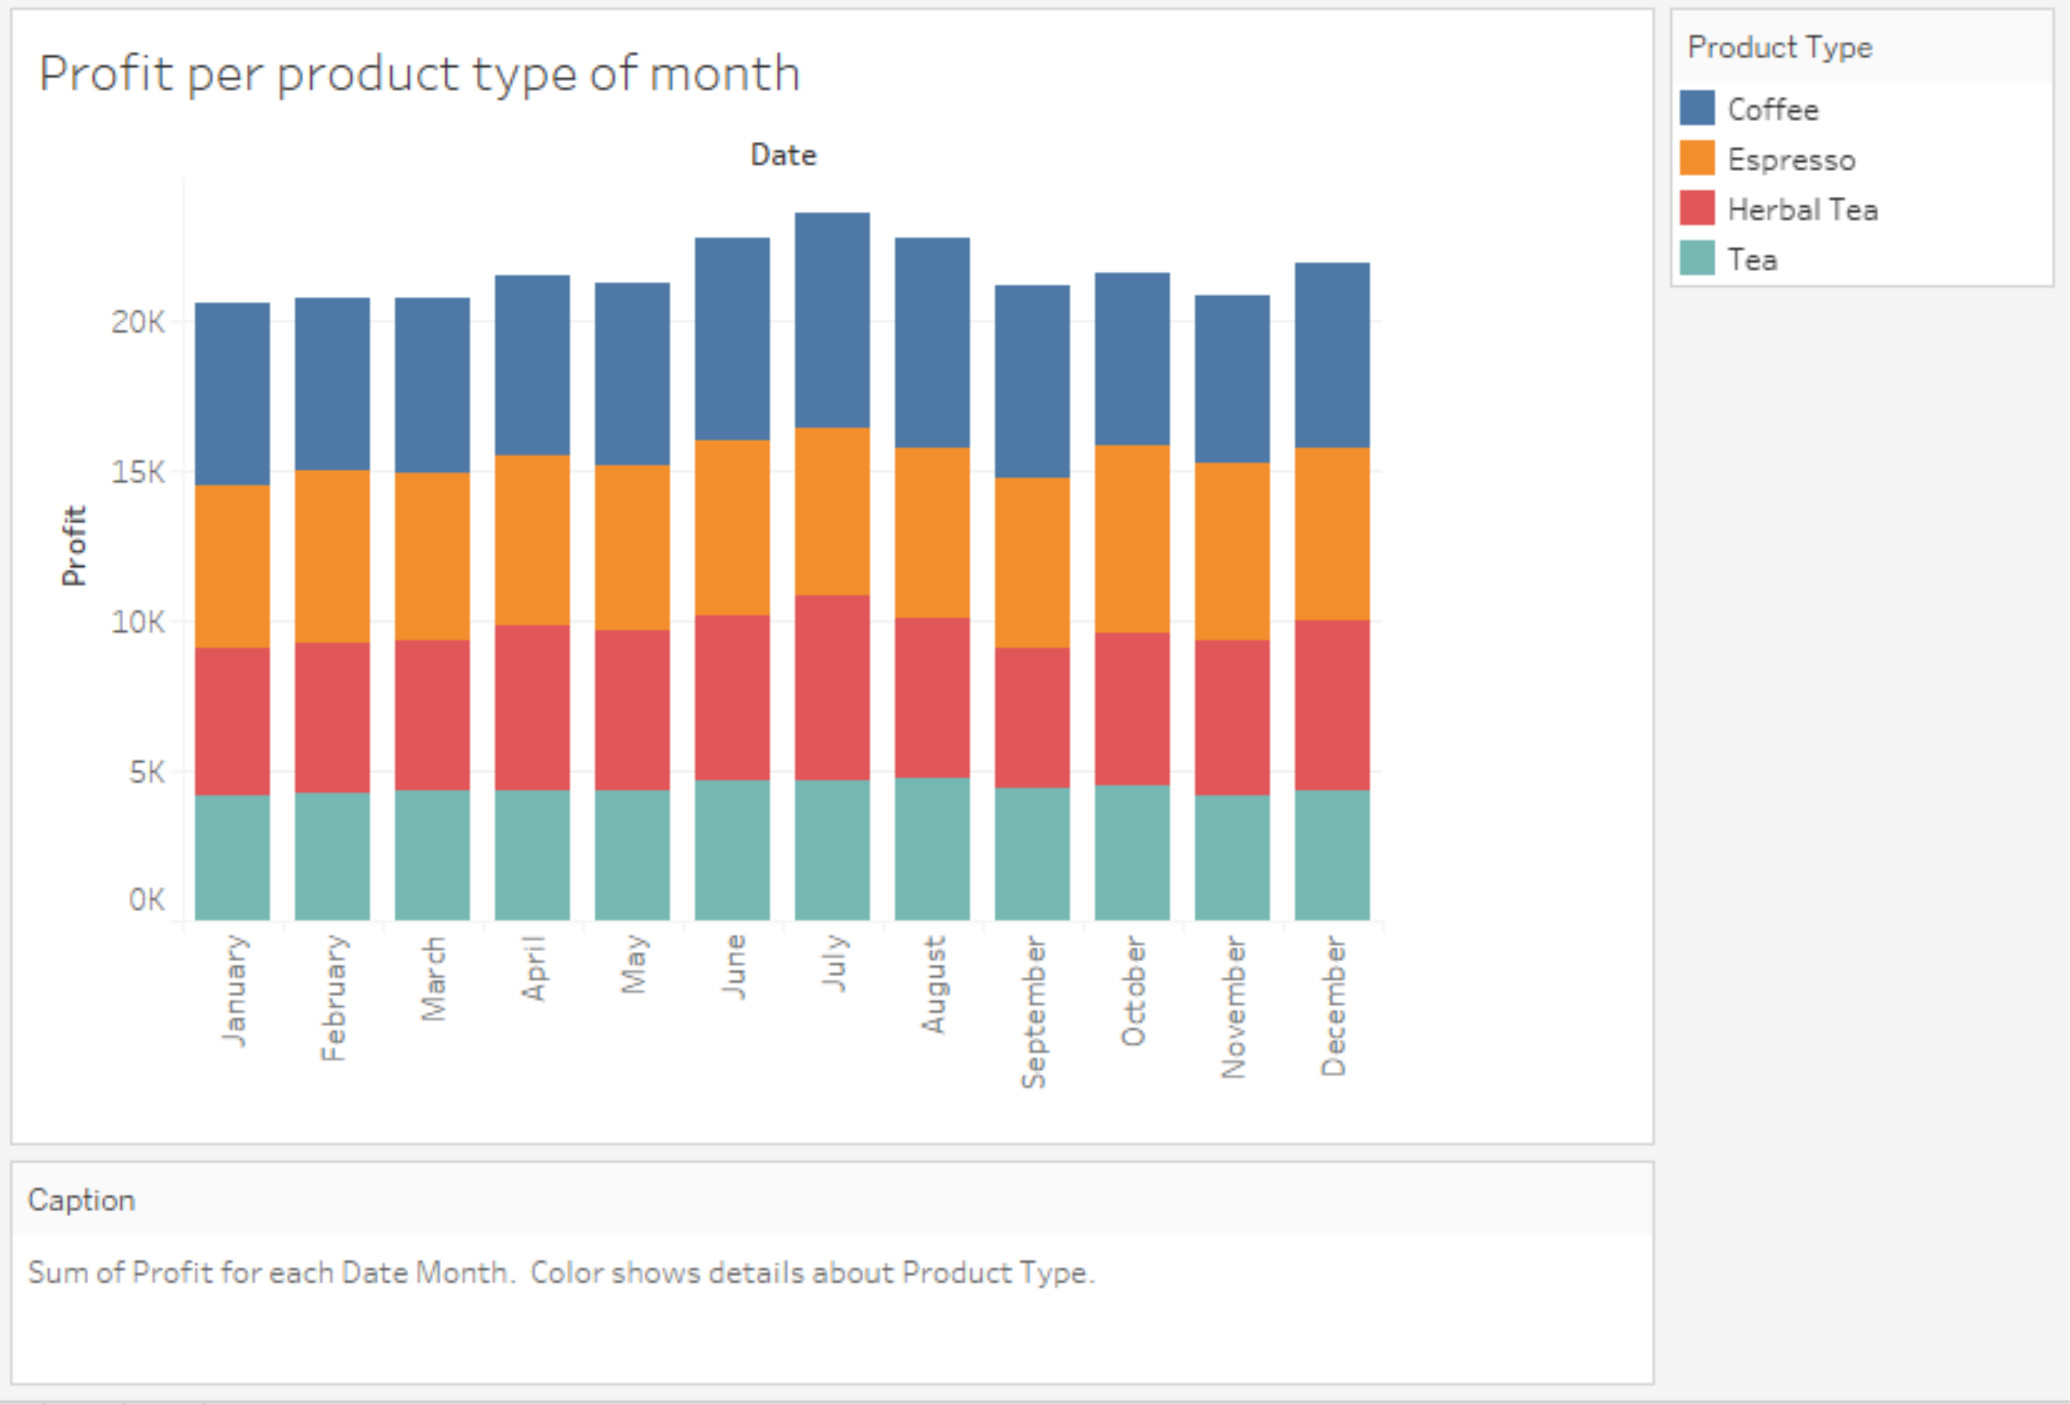
(3) Sum of profit per product line per month.
Submit the homework through Blackboard.